All collisions matter, but some result in far greater costs and have far more serious consequences than others. In our last post, we showed that the biggest costs for fleets come from liability, injuries, workers' comp, and lost productivity, not just repairs. The lesson was clear: fleets must not only count how often crashes happen, they must also measure how costly they are. Severity, not just frequency, defines true financial risk.
This post builds on that idea. Many smaller and mid-size fleets discount catastrophic risks because they haven't experienced them firsthand, but severity isn't only about rare events like infrastructure damage or pedestrian fatalities. A significant portion of severity is contributed by events that happen relatively often and can carry a high price tag.
Rear-end crashes are a prime example. They are among the most frequent collisions after backing and close quarter maneuvering (also known as parking), but unlike minor scrapes, they are far more likely to cause injuries, trigger litigation, total a vehicle (if the speed is high enough or leads to a rollover), and escalate into costly claims. On average, rear-end crashes cost five to six times more than a typical backing claim, according to client loss data combined with insights from Nauto's risk model. According to the National Safety Council, collisions with injuries averaged $44,000 in costs in 2023, while disabling injuries reached $167,000.
In this post, we'll detail why severity must guide safety priorities, spotlight how rear-end collisions can drive outsized financial impact, and provide a practical cost framework available as a downloadable guide to help you gather and organize the right data.
Frequency vs. Severity Explained
Fleet safety is often measured in terms of frequency, meaning how many collisions occur per million kilometers or miles, per driving hour, or per vehicle per year. This helps fleets track driver trends, but falls short in that it treats every incident as if it carries the same weight.
Reality is very different with the severity of a collision being a critical component in overall cost. Severity looks at the financial and operational impact of each collision: totaled vehicles that need to be replaced, liability claims, medical costs, downtime, lost productivity, and lost revenue. Even when catastrophic claims are eventually settled for less, they can still tie up cash on the balance sheet for years, money that could otherwise be invested in growth. In other words, frequency tells you how often crashes happen, but severity measures true financial impact.
The contrast is easy to see. Backing incidents account for about 25-35% of all collisions, despite drivers spending less than one percent of their time in reverse. They are frequent, but usually minor, because most backing is done at slow speeds and often involves striking stationary objects such as posts, signs, mailboxes, bollards, or parked cars. Rear-end collisions, by comparison, make up roughly 15–30% of crashes and are far more likely to result in injuries and high costs.
Real-World Contrast: Common vs. Costly Collisions
Nauto's insights from fleet loss data and our risk model make the difference clear. When fleets look only at frequency, the most common collisions dominate the statistics. Backing and stationary object contact, for example, account for 30 to 55 percent of all incidents yet only 7 to 9 percent of total costs. These low-speed bumps and scrapes keep body shops busy, but rarely threaten a fleet's financial health. Nauto's data shows that about 25% of these collisions are caused by distractions, which means they are often preventable, but even when they occur, their impact is relatively small.
At the other end of the spectrum are rare but catastrophic events. Collisions with pedestrians, cyclists, scooters, or motorcycles make up less than 2 percent of all incidents, yet they drive nearly 30 percent of total losses. These crashes often involve distraction or fatigue and can come with major consequences: life-altering injuries, fatalities, multimillion-dollar liability claims, depression for the driver that bears the emotional consequences of their actions, and reputational damage that can ripple through a business for years. Collisions with pedestrians contribute disproportionately to fatalities: The National Safety Council reports that pedestrians alone represented 17.9 percent of all traffic-related fatalities in 2023, underscoring their outsized impact.
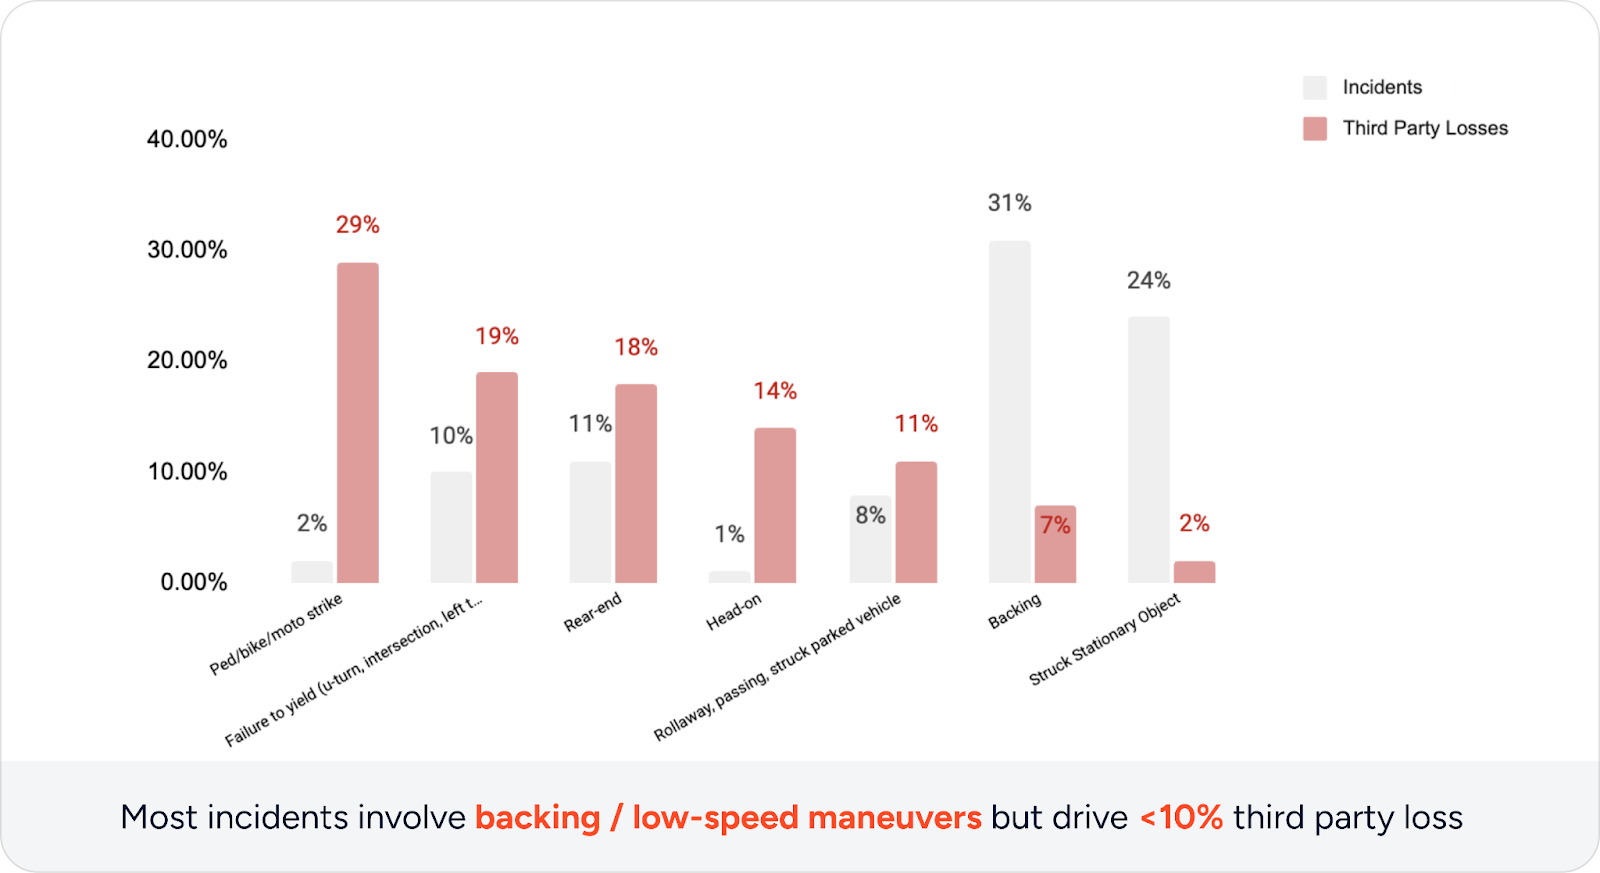
Lastly, there are collisions that combine both frequency and severity. Rear-end crashes, failure-to-yield or intersection accidents, and roadway departures are relatively frequent occurrences and are far more likely to involve injuries and litigation than backing. These incidents not only generate third-party liability claims, but also employee injuries, leading to workers' compensation costs, lost productivity, and driver turnover. Because they occur regularly and carry high average costs, they quietly drive a disproportionate share of fleet losses.
The takeaway is simple: the most frequent crashes often cost little, rare crashes can devastate, and high-frequency and high-severity collisions are what most often drive financial losses for fleets. This is why severity, not just frequency, must guide safety priorities.
How to Gather the Right Data
Recognizing that severity drives costs is only the first step. To act on it, fleets need to focus on the categories where severe events create disproportionate financial impact. Workers' compensation studies show that motor vehicle crashes generate the most expensive lost time claims of any workplace injury, often nearly twice the median claim cost. For companies whose factories don't involve dangerous substances or processes, motor vehicle collisions on the way to or from work, or when making deliveries or sales calls are often the largest cause of worker's compensation claims. That means the financial drain doesn't stop with repair invoices, it runs through insurance, HR, and even long-term balance sheet reserves.
To make these costs visible and measurable, the table below highlights the three essential categories every fleet should start with, while the full downloadable framework provides the complete set with a fill-in template.
| Category | Description |
|---|---|
| Third Party Auto Liability | Auto liability for damage to another person's vehicle or property in an accident or for bodily injury. |
| Third Party Litigated claims | Third party Auto Liability claims that may be handled and tracked separately from regular claims, either because they are very large, or went to litigation and include litigation costs, or settlements that are tracked in a legal budget vs regular insurance systems. |
| Worker Compensation (auto related) | State-mandated workers' compensation provides medical and wage benefits for job-related injuries. It's important to distinguish motor vehicle crashes from other incidents (e.g., slips, falls, factory injuries). |
Once gathered, losses should be converted into simple, comparable metrics such as total cost per vehicle per year, per mile, or per driving hour.
To ensure the picture is complete, ask three questions along the way:
- What's the true cost? Did we capture every category, or are we just looking at a single number?
- How do we compare? Are our severe incident costs aligned with national benchmarks, or are we performing better or worse than our peers?
- What's driving our losses? Are they concentrated in certain business lines, geographies, or vehicle types, and what's the best way to reduce them?
Answering these questions usually requires looking beyond the obvious. Insurance premiums must be included whether a fleet is self-insured or not, and rising rates of 18 to 20 percent annually make forecasting a challenge. Productivity losses add another layer: downtime for drivers and managers, missed deliveries or pickups, vehicle repairs, or retraining after a collision all take time and money. Even fuel consumption ties into safety performance. In looking at client data, Nauto has seen 5 to 7 percent fuel savings from driver behavior improvements alone, before any coaching is applied.
To make the process easier, we are providing the full version of our cost framework as a downloadable guide. It includes space to fill in your own numbers and a column for identifying who in your organization owns each dataset. With this, fleets can avoid guesswork, ensure that all major cost categories are accounted for, and focus preventative efforts where they matter most.
This is the process Nauto uses with every client we work with. We help fleets uncover hidden costs, connect the right data owners across the organization, and build a clear picture of where losses are happening. If you'd like support in understanding your true financial picture related to fleet safety, our team can help you find the data, fill in the gaps, and turn it into actionable insights.
Making Roads Safer, Helping Fleets Thrive
As the CEO of Nauto, my mission is to transform the way fleets operate by making roads safer. With the power of technology and AI, we give leaders the insight to focus on both the frequency and severity of collisions so they don't just cut costs—they protect lives, strengthen their businesses, and build safer communities. We uncover the data that matters, connect the right people across your organization, and give you the clarity to act where it counts most. Together, we can turn safety into a powerful driver of both performance and financial impact.

Related posts


Is Nauto right for your fleet?
Get in touch, we’ll answer questions or set up a demo.